
Too Much Manual Reporting? Here’s How to Fix It Without Hiring More Analysts
If you’re a CFO, COO, or operations lead, you’ve likely heard this complaint: "We spend too much time on manual reporting."
And if your team is still chasing spreadsheets, copying and pasting across systems, and running the same reports over and over again, it’s not just a time sink, it’s a risk to your business.
In this article, we’ll cover:
Why manual reporting slows down decision-making
The hidden costs you might not see
What modern reporting looks like
Tools and techniques to automate without extra headcount
How to take the first step toward reporting that runs itself
Why Manual Reporting Is Still So Common
Manual reporting sticks around for a few reasons:
It’s familiar
It “works” for small teams
There’s no time to fix it because the team is too busy doing it
But as your business scales, the cracks show up fast. Reports take longer to produce. Data lives in too many places. Teams don’t trust the numbers.
We’ve worked with clients who were spending 10, 20, even 40 hours a week on manual reporting across finance, sales, operations, and marketing.
The Real Cost of Manual Reporting
Time is the obvious one. But the real costs go deeper:
Decision delays: When reports take days, decisions wait too
Data errors: Manual steps mean mistakes that go unnoticed
Frustrated teams: Staff burn time building reports instead of acting on them
Missed opportunities: You’re slower to respond to what’s really happening
And over time, this adds up, missed revenue, misallocated spend, and an inability to scale operations.
Signs You’ve Got a Manual Reporting Problem
Ask yourself or your team:
Do we run the same reports every week or month by hand?
Are we copying and pasting across systems like Xero, Excel, HubSpot, or project tools?
Does it take more than an hour to answer basic business questions?
Do different teams argue over whose numbers are right?
Do we scramble at month-end to pull it all together?
If yes, your reporting process is working against you.
What Modern Reporting Looks Like
Modern reporting is built on automation, not effort. Here’s how it works:
Data flows from tools like Xero, GA4, HubSpot, or Salesforce into a central data platform
That data is cleaned, matched, and transformed automatically
Dashboards and reports are updated live, no one touches a spreadsheet
Instead of building the report, your team filters what they need and gets answers in minutes.
Benefits of Automating Your Reporting
Our clients across Australia have seen results like:
Up to 80% time saved on monthly and weekly reports
Significant drop in reporting errors
Faster insights, so leaders act sooner
Fewer meetings to agree on the numbers
Happier teams, with more time to focus on work that matters
Automated reporting also means you can answer new questions quickly, not wait a week to build something from scratch.
What Tools Make This Work
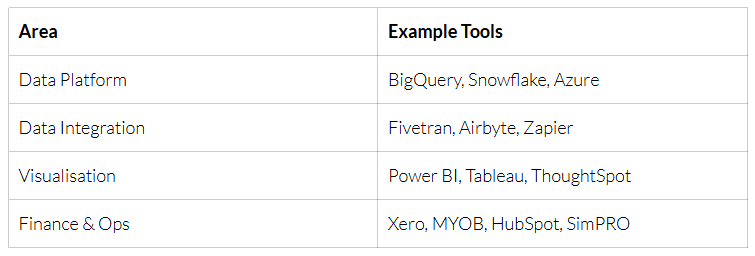
Make it stand out
Whatever it is, the way you tell your story online can make all the difference.
We help clients pick the right combination based on their team, budget, and systems.
Real Example: From Manual to On-Demand Reporting
A mid-market company in the professional services space was spending 25+ hours a week on manual reporting across sales and finance.
They had data in:
Xero for financials
HubSpot for pipeline and CRM
Excel for weekly board reports
We helped them:
Build a central data platform in BigQuery
Integrate their systems through automated pipelines
Design real-time dashboards in Power BI
Results:
Report prep time dropped from 6 hours to under 20 minutes
Data quality improved, and teams started using reports more often
CFO and COO could see key numbers any time, not just end-of-week
You Don’t Need to Hire to Fix This
Most companies assume better reporting means hiring analysts or buying expensive platforms.
But we offer a different approach, a fractional data team that works with you to:
Map out your current reporting setup
Recommend ways to automate what’s already working
Build dashboards and data pipelines without you lifting a finger
This means you get:
Ongoing reporting support
Clear insights faster
No need to hire in-house or manage more software than you need
How Pentify Insights Can Help
We work with growing companies across Australia that are drowning in manual reports.
Our model is built around:
Data strategy and advisory: understand where to start
Data as a Service (DaaS): get access to a team who builds and supports the solution
Reporting and dashboards: see what’s happening in your business clearly and instantly
All without needing to hire more analysts or data engineers.
How to Start Fixing Manual Reporting
Pick your highest-effort report: the one that takes too long or causes the most stress
List where the data comes from: tools, spreadsheets, files
Talk to someone who can help automate: even a small win can save hours
We’ve helped businesses fix reporting in weeks, not months. And the impact lasts.
Final Word
Manual reporting might be familiar, but it’s not sustainable.
The time, errors, and frustration it causes can be solved, without hiring or overhauling your whole tech stack.
If your team is spending too much time on manual reporting, there’s a better way. Let’s talk.
Get in touch with Pentify Insights and see how fast we can get your team out of spreadsheets and into insight.