
From Silo to Symphony: How Breaking Down Internal Barriers Doubles Data Impact
Most organisations say they want to be data driven, but many never reach it. The biggest barrier is not technology. It is the walls inside the business.
Departments use different tools, collect their own metrics and protect their own data. The result is silos that limit collaboration and weaken insight. When those silos fall, something powerful happens. Teams align, insights connect, and data impact multiplies.
Breaking down barriers turns isolated information into a shared asset. That shift can double the value of data and analytics across the organisation.
What internal barriers really look like
Silos form slowly. They start as efficiency measures, finance manages its own systems, marketing runs its own dashboards, operations tracks its own KPIs. Over time, those lines harden and the business fragments.
Common examples include:
Technology silos: different tools, formats or systems that cannot communicate
Organisational silos: teams with conflicting goals or reporting structures
Cultural silos: reluctance to share data across functions
Language silos: inconsistent definitions of metrics and entities
When data is fragmented, trust erodes. Teams argue over whose numbers are correct. Decision making slows.
Why breaking silos multiplies data impact
McKinsey found that companies leading in data and analytics are three times more likely to report that analytics contributed 20 percent or more of EBIT over the past three years (source). These companies treat data as a shared foundation for decisions, not a departmental resource.
Here is what changes when silos fall:
1. Insights connect across teams
When marketing, product and operations share the same view of the customer, patterns appear that no single team could see. Cross-functional data drives better ideas and faster action.
2. Work moves faster
Analysts spend less time collecting or reconciling data. They focus on analysis instead of maintenance.
3. Data assets get reused
A model built for one purpose can serve many others. A marketing segmentation can help finance forecast revenue or product prioritise features.
4. Experiments scale
Unified data allows company-wide testing. You can measure how a campaign in one channel affects customer behaviour in another.
5. People start to trust data
When everyone uses the same definitions and the same source, reports align. People argue less and decide more.
How to break down silos
1. Set a shared vision
Define what data success looks like and which business outcomes it supports. Keep the vision simple and measurable.
2. Standardise definitions
Agree on consistent terms for metrics such as customer, lead, and revenue. Clarity here prevents confusion later.
3. Build connected infrastructure
Use modern platforms such as Snowflake, BigQuery or Microsoft Fabric to link data sources. Shared infrastructure creates access while maintaining security.
4. Empower domain teams
Give departments ownership of their data, but within common standards. A federated approach, often called a data mesh, balances autonomy with consistency.
5. Run cross-functional projects
Start with initiatives that require cooperation between teams — for example, lifetime value analysis or churn prediction. Deliver results quickly to prove the benefit.
6. Align incentives
Reward collaboration. If marketing and product share responsibility for retention, they will share insights too.
7. Improve data literacy
SAS refers to this as closing the analytics leadership gap — building decision-making skills across the business, not just at the top (source).
Train people to read and interpret data. The more teams understand analytics, the less they depend on a central team for every answer.
8. Create transparent feedback loops
Encourage teams to challenge assumptions with evidence. MIT Sloan describes effective data leadership as built on transparency and curiosity, where leaders are willing to say “show me the data” (source).
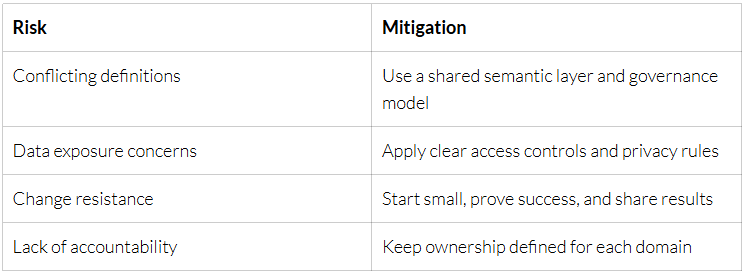
Managing the risks
Breaking silos does not mean losing control. It means building systems that encourage collaboration while keeping standards.
Evidence from the field
Real-world examples back this up.
Phoenix Children’s Health connected more than 120 systems into one data warehouse, improving reporting and decision speed (CIO).
Forrester reports that businesses unifying data: AI and analytics activate outcomes faster and see higher innovation rates (Strategy Software summary).
Forbes Tech Council highlights that integrating data across departments strengthens customer experience and operational alignment (Forbes).
Across industries, the conclusion is the same: shared data delivers higher performance and agility.
Culture is the key
Technology solves access, but culture drives impact. Data integration only works when people trust each other and share responsibility for outcomes.
Promote openness. Publish dashboards internally. Recognise teams that collaborate across departments. When data sharing becomes normal, results accelerate.
Final thought
A company divided by silos is like an orchestra where each section plays a different tune. Connecting your systems and your people turns noise into harmony.
When data flows freely across teams, insight compounds and business impact multiplies. The result is not just better analytics, it is a stronger, faster organisation that learns and adapts together.
That is how you move from silo to symphony.