
Why Is My Reporting Always Out of Date?
In today’s fast-paced business world, timely information drives confident decisions. Yet many teams still rely on reports that lag behind reality. You log into your dashboard only to find last week’s figures. Your team chases down data from scattered spreadsheets. You wonder: why is my reporting always out of date?
In this article we explore common causes of stale reporting, show how out-of-date data undermines your plans, and outline practical steps to achieve real-time insights. We also share links to trusted resources so you can dig deeper.
The Cost of Out-of-Date Reporting
Out-of-date reports do more than frustrate. They:
Lead to poor decisions. Executives act on wrong trends, budgets misalign, marketing overspends.
Waste time. Teams chase manual updates instead of analyzing.
Reduce trust. Stakeholders view dashboards as unreliable.
Common Causes of Stale Data
Manual Processes
Copy-pasting data from Excel files
Emailing spreadsheets across teams
Updating dashboards by hand
Disconnected Systems
Sales data in one CRM, finance data in another
Data silos that require export/import
Lack of automated connectors
Batch-Oriented Pipelines
Overnight ETL jobs that run once per day
Scheduled database exports that miss midday changes
Complex Transforms
Heavy data cleansing that takes hours
Data models that require multiple passes
Infrastructure Limits
Legacy databases without streaming APIs
Tools that cannot handle real-time loads
Real-Time vs Batch Reporting
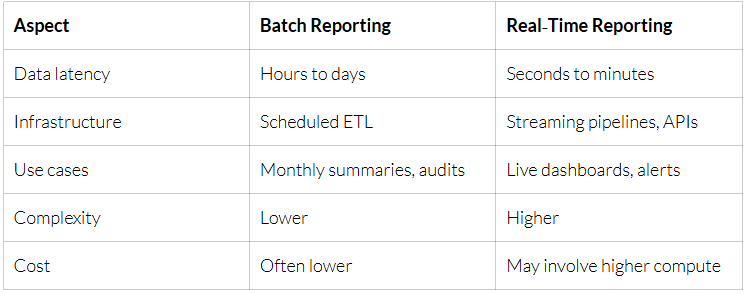
Batch reporting works for retrospective analysis or monthly close. But when you need up-to-the-minute insights, like tracking ad spend in real time, batch can fail you. Real-time reporting relies on tools like Apache Kafka or change-data-capture to stream updates from source systems into dashboards.
Five Steps to Fresh Reporting
Map Your Data Sources
List every system: CRM, ERP, marketing tools, customer support.
Identify how often each system updates.
Automate Data Ingestion
Adopt Streaming or Micro-Batch Pipelines
For high-velocity data, implement streaming platforms (e.g. Kafka, AWS Kinesis).
For moderate volumes, run ETL every 10–15 minutes.
Build a Centralized Data Warehouse
Consolidate tables in Snowflake, BigQuery or Redshift.
Model data in star or snowflake schemas for fast queries.
Choose the Right BI Tool
Select tools that support live queries (e.g. Looker, Tableau, Power BI).
Enable query caching wisely to balance performance and freshness.
Tools and Technologies
Data Integration
Fivetran, Stitch, Hevo for automated connectors
Custom Python scripts using APIs
Streaming
Apache Kafka, AWS Kinesis, Google Pub/Sub
Data Warehouse
Google BigQuery for serverless analytics
Snowflake for elastic scaling
Amazon Redshift for AWS users
Business Intelligence
Looker for data modeling and embedded analytics
Tableau for rich visualizations
Microsoft Power BI for tight Office 365 integration
Measuring Data Freshness
To maintain confidence in your reporting, track these metrics:
Latency: time between event in source and availability in report
Sync Frequency: interval of data ingestion jobs
Staleness Alerts: notifications when data lag exceeds threshold
Set an SLA for each dashboard. For example:
Sales pipeline: latency under 5 minutes
Financial close: latency under 1 hour
Use monitoring tools like Prometheus or Datadog to raise alerts when pipelines slow down.
Conclusion
Out-of-date reporting costs time, trust and money. By mapping your sources, automating ingestion, and adopting streaming or micro-batch pipelines, you can deliver insights that reflect the moment. Pair a modern data warehouse with a BI tool that supports live queries, and measure freshness to catch issues early.
Fresh reporting transforms data from a static archive into a dynamic decision engine. Start small, sync your highest-priority table every few minutes—and expand until every dashboard you open shows today’s reality, not yesterday’s.