
King of the Codes – Part II
It has been over a year since the Chairman of the NRL boldly claimed that the NRL was the number one sporting code in the country, prompting the Pentify team to scrutinise this daring declaration in part I of King of the Codes. With the dust now settled on newly-established feature rounds in the form of Magic round and Gather round for the NRL and AFL respectively, we thought it would be a good time to revisit this topic with some updated data insights (obviously!) and restart the conversation, perhaps making a couple of courageous proclamations ourselves.
For those not familiar with these unique rounds, the idea is simple. An entire round of matches is played in one city. Matches are supported by a raft of activities in the city of choice to not only increase interest in the code and driving economic benefits for the host city, but importantly to create a festival-like atmosphere for attendees to fully immerse themselves in. It is a concept mirrored across both codes, and fair to say they have become the jewel in the crown for both codes, at least they would have us believe. Anecdotal evidence suggests that both Magic round and Gather round have been raging successes, with executives, players, media personalities and fans quick to proclaim the rounds as their favourite of the season. However, executives are of course going to focus on the positive aspects of these rounds, and media personalities indulging in a weekend of “cashies” is also going to lead to similar reviews. But, what can data tell us about the actual success of these rounds?
Can part II of our king of the codes series unearth some new insights that can, once and for all, determine the real king of the codes? In part I we looked to settle the score by looking at membership and attendance data. In part II, we are going to explore attendance figures once again, but add to the fold analysis of the economic impacts of these rounds. We may even throw in a couple of interesting data points we noticed that might tip the ledger one way or the other. We will be using ThoughtSpot to visualise our data, and if any readers would like to find out more about ThoughtSpot, please reach out to us, you’ll be glad you did. Let’s get into it!
1. Attendance
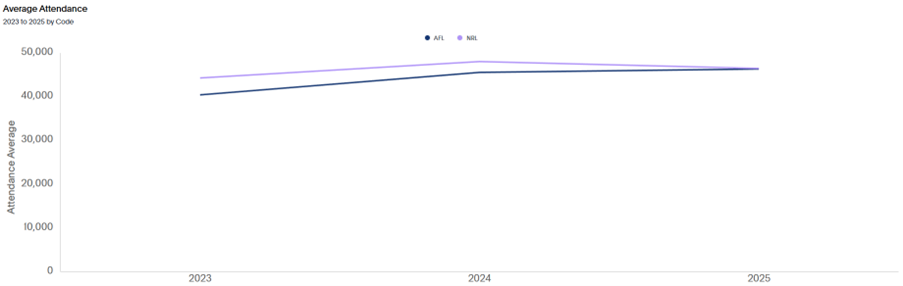
The NRL play all games at Brisbane’s Suncorp Stadium, with a capacity of 52,500. The AFL on the other hand play games at multiple venues, a strategy devised by the AFL in partnership with the South Australian Government to showcase surrounding regions, including an investment of over $40m into development of the Barossa Oval, in the regional town of Lyndoch. The epicentre of Gather Round remained Adelaide Oval, which has a capacity of 53,500, and has hosted more than half of the Gather Round fixtures across the 3 years Gather Round has been going for. Therefore, it is only fair that our analysis will focus on Adelaide Oval v Suncorp Stadium.
It is quite remarkable not only how similar both codes are when it comes to attendance, but also the positive trend of attendance growth year-on-year. As we discovered in part I, the AFL is probably the attendance king overall, mainly due to the abundance of games played at the 100,000-seat MCG each week, so the attendance data above would bring a smile to those governing the NRL.
Our attendance verdict? NRL
2. Economic Impact
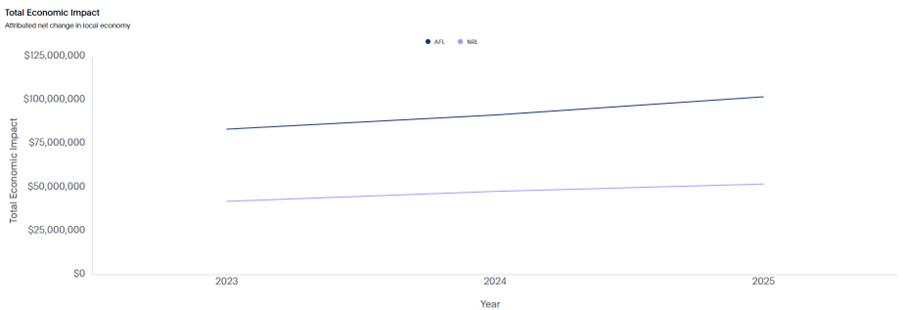
The above chart now starts to turn the ledger the way of the AFL. Whilst economic impact data is extremely difficult to fully quantify, even if we accounted for some wiggle room in these figures, the economics shine favourably on the AFL. In 2025, it is expected that the economic impact of Gather Round will exceed $100m once it has been fully quantified. That nearly doubles the economic impact of Magic Round to Brisbane.
Our economic impact verdict? AFL
3. What else caught our eye…
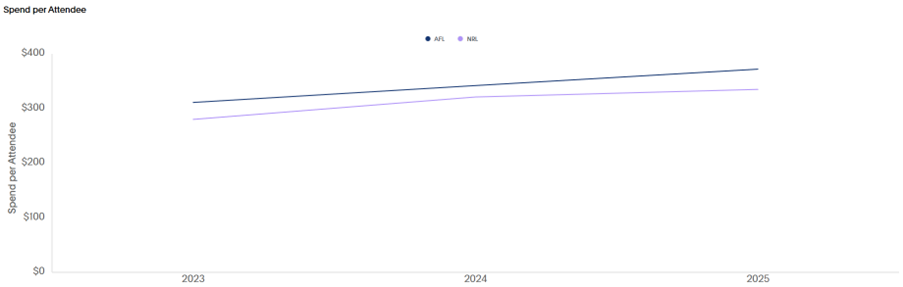
Upon reviewing the total economic impact, we wanted to expand this to a per-attendee spend figure. There is little to separate the two codes on a per-attendee spend, with the AFL marginally ahead, but if this were an election coverage, we would probably be concluding “too close to call”. As such, we’ve delved deep into our bag of tricks to find some slightly different takes of these rounds, to see if we can separate the two codes.
Caxton Street runs dry – It has been reported that Magic Round 2025 saw many venues on the iconic strip run out of stock, marking the street’s highest-ever trading weekend.
Bounce around the Barossa – The hop on/hop off bus service reported an increase of over 500% in passengers across the Gather Round weekend.
Ticket Tariffs – Whilst the AFL has done their best to keep ticket prices consistent for Gather Round, 2025 saw the NRL raise Magic Round ticket prices to the tune of 500%, ouch!
Our final verdict? DRAW
As was the case in King of the Codes part I, we are unable to find a definitive winner in the hotly-contested race to be the King of the Codes in Australia. Even when revisiting tried and tested metrics such as attendance, and expanding to new and slightly different metrics, finding a clear winner remains too tough for us to determine, for now.
Once again, we will have to leave it to the experts in each camp to give us, the punters, reasons as to why their code’s showpiece weekend is better than the others. We will remain committed to trying to break this deadlock, but we will once again need to go to penalties. Perhaps the real king remains cricket…