
How to Build a Dashboard from Multiple Data Sources
Bringing data together from different systems into one dashboard is one of the most effective ways to improve business decision-making. When teams can view sales, marketing, finance and customer insights in one place, it's easier to spot patterns, track performance and take action.
This blog walks through how to build a dashboard from multiple data sources, with a focus on choosing the right metrics first, selecting tools that work for your team, and building trust in the data you see.
Start with the Right Questions
Before touching a dashboard tool or connecting data, get clear on what you actually want to measure. Start by asking:
What are the core goals of your team or business?
What metrics reflect success or progress toward those goals?
Who will use the dashboard, and what decisions will it support?
This helps prevent the common trap of tracking too much or the wrong things. Keep it simple and purposeful.
Example Questions to Guide Metric Selection
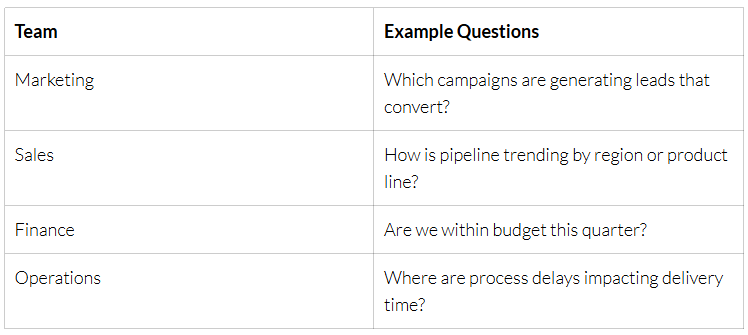
Make it stand out
Whatever it is, the way you tell your story online can make all the difference.
Benefits of Multi-Source Dashboards
Holistic Insights You can see performance across departments and systems in one view.
Faster Decision-Making When everything is in one place, it reduces the time spent switching between tools or manually compiling reports.
Improved Accuracy Fewer manual steps mean fewer errors.
Custom Views for Different Roles Tailor dashboards by team or user need, whether it's margin metrics for finance or lead quality for marketing.
Stronger Strategic Planning Trends and patterns emerge when all the data is side by side.
Step-by-Step Guide to Building the Dashboard
1. Define the Metrics That Matter
Choose the most important 5 to 10 metrics that reflect business goals. Avoid vanity metrics. Focus on those that help you:
Track performance
Spot risks or inefficiencies
Make faster, smarter decisions
2. Map Your Data Sources
List the systems that contain the data for those metrics. Common examples:
Google Analytics 4 (GA4)
HubSpot, Salesforce
Xero, MYOB, QuickBooks
Excel, Google Sheets
Internal databases or APIs
Include where the data lives, who owns it, and how often it updates.
3. Choose a Data Integration Method
You can bring your data together in a few different ways:
A. Manual Import
Download CSVs or spreadsheets from each system and import into a central Excel file or dashboard tool. Simple but time-consuming. Fine for one-off dashboards.
B. Direct Connectors
Many BI tools offer native integrations. These are quick to set up but limited in data transformation.
C. Data Platform + ETL Tool
Use a data warehouse (BigQuery, Snowflake) and connect your systems with a tool like Weld, which syncs your data automatically. This setup is ideal if you want dashboards that scale.
4. Clean and Structure the Data
Raw data often needs to be reshaped before it's dashboard-ready. Common tasks include:
Standardising dates and currencies
Matching naming conventions (e.g. customer IDs)
Removing duplicates
Filling in missing values
Consistent structure ensures your metrics are accurate.
5. Build the Dashboard
Use a BI tool to design a dashboard around the metrics you prioritised in Step 1.
Popular tools:
Power BI: Great for Excel-heavy teams
Tableau: Offers deep visual flexibility
ThoughtSpot: Lets users explore data using plain language queries
Google Data Studio: Simple, free option for Google-connected data
Use a mix of:
Summary metrics (e.g. total revenue, cost per lead)
Trend charts (e.g. weekly performance)
Filterable tables (e.g. campaign or product-level breakdowns)
6. Validate, Test and Refine
Always test your dashboard with users before launch:
Check numbers against known reports
Ask whether it answers the right questions
Refine filters, naming, layout and logic
Dashboards should help people work better, not just display data.
7. Automate Where Possible
Use scheduled refreshes or live connections so the dashboard stays up to date without manual effort. Tools like Weld let you control sync frequency and monitor data freshness.
Tips for Success
Start small: Focus on a handful of valuable metrics first
Document your logic: Be clear on how metrics are calculated
Keep users involved: Build for their decisions, not just your curiosity
Avoid overengineering: A basic dashboard that’s used is better than a complex one that’s ignored
Keep iterating: Dashboards evolve as your questions and systems do
Example: Marketing + Sales Dashboard
A SaaS company wants to understand how ad spend converts to revenue.
Key metrics:
Cost per lead
Website conversion rate
Pipeline by campaign
Revenue by source
Data sources:
Google Ads and Meta Ads
GA4 for website performance
HubSpot for lead capture
Salesforce for opportunity and revenue data
Approach:
Use Weld to connect all sources into BigQuery
Clean and model the data using dbt
Visualise in ThoughtSpot for fast filtering and ad hoc queries
Result:
Marketing sees which channels drive revenue
Sales identifies the best-performing lead sources
Executives have daily access to pipeline trends
Wrapping It Up
Building a dashboard from multiple data sources is more than a technical challenge. It starts with clear questions and good metrics, then follows through with the right tools, clean data and thoughtful design.
The end goal isn’t just prettier charts. It’s helping teams make smarter decisions, faster, using data they can trust.