
King of the Codes
How our sporting codes use data to lay claim to the throne
Growing up in Australia, it is almost impossible to not have at least some interest in sport. The warm climate driving our outdoor lifestyle, our competitive nature, all underpinned by strong funding structures (both public and private) and some of the best stadiums and training facilities in the world, you could say that sport is in our DNA. For a country with a tick over 25 million people (putting us around the 50th most populous nation in the world) we certainly punch above our weight on the global stage, regularly finishing in the top 10 on the summer Olympic medal table (we will ignore the colder version of the Olympics for the sake of our argument). This desire to be number one is a trait that runs deep in the Australian mentality. So, it hardly comes as a shock to see the passion and vitriol when the topic of Australia’s biggest sporting code is brought up.
To follow our recent commentary the rising prevalence of data and analytics in the AFL, and with the unique beginnings of the two major winter codes in the past couple of weeks, we thought we would look at how the AFL and NRL leverage data to help them justify their claim to be Australia’s number one sporting code.
Recently the chairman of the NRL has put this topic of conversation on the national radar yet again, proudly declaring that the NRL was already the number one code in the country ahead of the AFL in position two, and this was prior to him announcing record revenue figures for the code. This got us thinking, are his claims correct? What data is he using and how is he using it to draw this conclusion? Is there objective data available to support the claim that NRL is king? Or does the crown sit with the AFL? Pentify Insights think we are in a pretty good place to investigate this topic, as there has never been more readily available data and insights available to assist us in taking a magnifying glass to his claim and settle this once and for all.
1. Attendance
One of the most common metrics spoken about by league boffins is the number of fans they get through the turnstiles for each game.
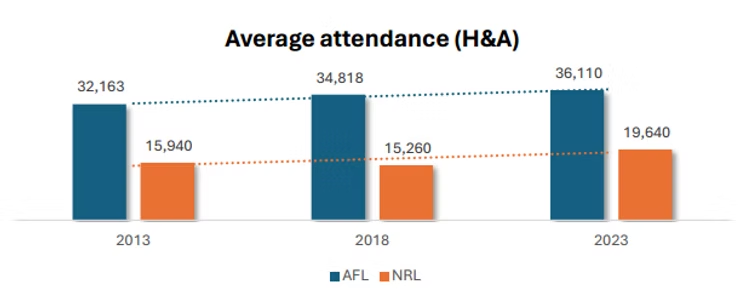
There is no doubt that the AFL draws a bigger crowd than the NRL. On the evidence above, one might simply conclude that the AFL wins the attendance battle hands down. However, there are some key factors to consider. Firstly, the AFL enjoys an all-but mortgage on the MCG during the season, hosting up to 4 games per round for their 5 clubs that call the ‘G home, with capacity of over 100,000, and has similar structures in Adelaide and Perth. Compare this to the NRL where home grounds are still for the most part, smaller suburban stadiums. This leads us into our second point, capacity. Using 2023 data, the average capacity for AFL games was 58,000, compared to that of the NRL of just 27,600, meaning stadium utilisation for the AFL landed at 62%, compared to the NRL of 71%. Finally, the NRL is also growing their attendance at a faster rate than the AFL. So, whilst the AFL holds the lead in overall attendance, the NRL can view this data through a different lens (utilisation and growth) to conclude that they are the attendance kings.
Our attendance verdict? DRAW
2. Television Audience
The next metric code executives love to talk about are TV ratings.
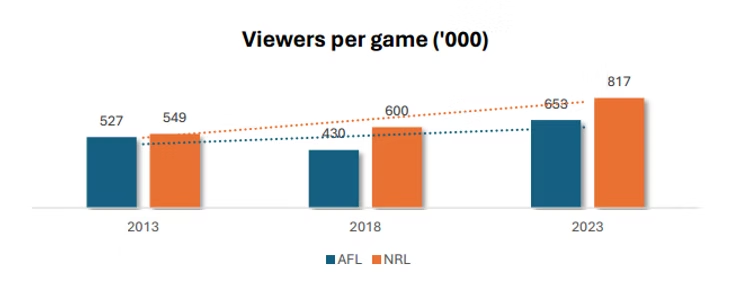
This is an area that was particularly put under the microscope by the NRL in recent times, and it is no surprise given the above numbers. The NRL excels at getting TV eyeballs on their product. There are some likely explanations for this, including one we touched on earlier of suburban stadiums, perhaps making it tougher for your Sydney NRL fan to get to a game compared to a Melbourne AFL fan with the centralised stadiums in Melbourne. Notwithstanding, on these figures alone (which excludes State of Origin games), it is hard for the NRL not to claim victory in the TV battle.
Our TV verdict? NRL
3. Broadcast Revenue
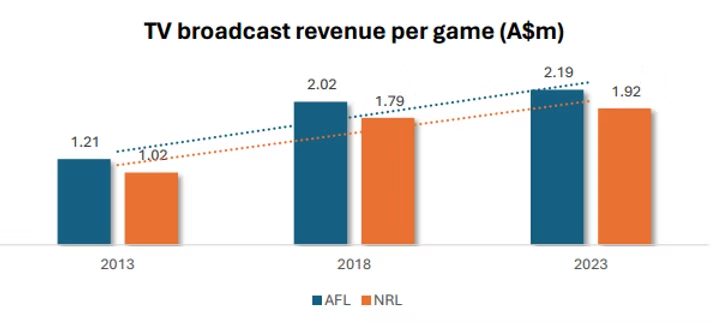
It doesn’t seem that long ago that the AFL were shouting from the rooftops about their $1.25b Australian-record 5-yr TV rights deal, a fraction over $250m per season. That was 2011, and at that time it was a 60% increase in broadcast revenue from the previous deal struck 5 years earlier. It is quite remarkable to think that since then, broadcast figures have only continued to sky-rocket, with the AFL generating $473m from broadcast revenue in 2023, or $2.19m per game (vs $1.21m in 2013). Not to be outdone is the NRL, just behind the AFL at $1.92m per NRL game in 2023. NRL figures are also nearly double what they were 10 years ago. These figures will no doubt please AFL and NRL executives alike.
Our broadcast verdict? DRAW
4. Club Membership
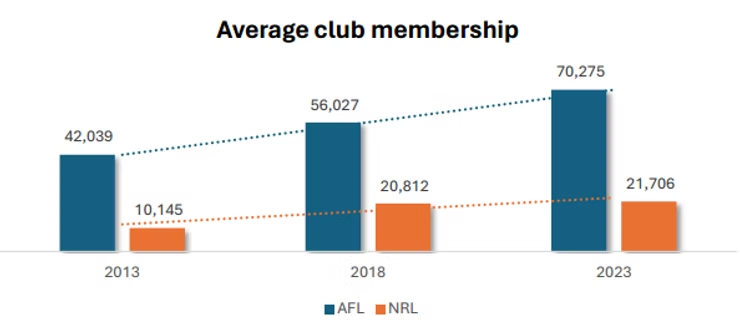
Our final metric we will put under the microscope is club membership. Whilst the NRL have managed to show significant growth across a 10-yr timeframe, club membership is clearly an area the AFL excels in. Varying membership options, greater accessibility to games, and the fact that the AFL has done a mountain of work to improve the quality of their product over this period, it is unsurprising to see that the AFL-supporting public are happy to part with their hard-earned each year to support their club.
Our membership verdict? AFL
Final verdict? 1-1 DRAW!
Trying to settle this argument in normal time was always going to be difficult, so it is no surprise that we need extra-time to settle this one. We may well revisit this topic in the future, but for now, we will have to make-do with a 1-1 draw.
As a sports-loving nation, we are extremely fortunate to have both sports thriving in Australia for many reasons. But determining who wears the crown is all down to what metrics they use, and more importantly, how they use them. We’ve taken a view of 4 performance metrics above and proved that both codes can indeed justify their claims depending on the what and the how.
Sound familiar?
The what and the how, finding the right data to support a previous business decision or idea. This is a situation that many businesses will find themselves in today, using data in a way to fit a desired outcome, and it is an all-too-frequent problem. In an age of extreme competition, time pressures and cost challenges, letting the data drive the conversation, not the other way around, is vital for better decision-making and therefore performance.
This will no doubt resonate with you as you read this piece, and perhaps you are thinking that it is too hard to try and change the way you and your company uses data. But we can show you that it does not have to be difficult, time-consuming, or costly to use your data in the right way. Whether it is a data and analytics gap analysis, data literacy programs, or guidance on your existing data strategy, Pentify Insights can help with all of this and more, ensuring you make business decisions where the data is doing the talking, not the other way around. This is even more important when you’re laying claim to be the best, just as these two major codes have done in recent times.
On this occasion, we couldn’t split them. Who knows, perhaps the real king is cricket .