
How to Combine GA4 and HubSpot in One Dashboard (With Real Examples)
If you’re a marketing or growth leader, chances are you’ve got GA4 and HubSpot running side by side. But here’s the problem — they don’t talk to each other.
You end up toggling between platforms, trying to stitch together how your website traffic, conversions, and pipeline actually connect.
This is where a combined dashboard can save hours each week and give your team the visibility they need.
In this article, we’ll break down:
Why combining GA4 and HubSpot matters
What you can actually track when they’re together
How to connect them in a single dashboard
Real-world examples of what it looks like
Tools to use, and what to watch out for
Why Combine GA4 and HubSpot in the First Place?
GA4 is great at tracking what’s happening on your website, page views, sessions, bounce rates, and goal completions.
HubSpot, on the other hand, tracks what happens after someone becomes a lead, emails, sales activity, deals, revenue.
But they only show you half the story.
To make better decisions, you need to see:
Where your traffic is coming from
Which sources are converting to leads
What campaigns are actually driving pipeline and revenue
You can’t answer those questions unless you bring GA4 and HubSpot together.
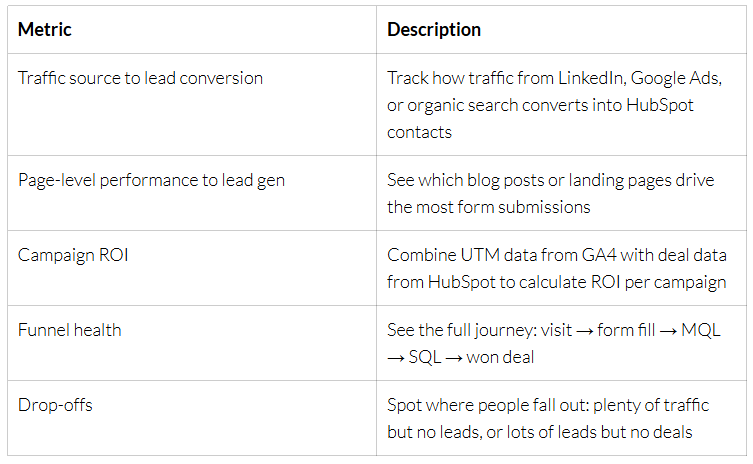
What Can You Track With a Combined Dashboard?
Once connected, you can build a unified view of:
Make it stand out
Whatever it is, the way you tell your story online can make all the difference.
Step-by-Step: How to Combine GA4 and HubSpot in One Dashboard
Step 1: Set up a Data Warehouse
Use a platform like Google BigQuery, Snowflake, or Azure to create a central place to store your data.
Step 2: Connect Your Sources
Use tools like:
Weld to bring in GA4 and HubSpot data
Or if you’re using HubSpot Enterprise, you can connect GA4 through its custom behavioural events or API
Step 3: Clean and Match the Data
You’ll want to match on:
UTM parameters (campaign, source, medium)
Email addresses or user IDs (if logged in)
Timestamps (to align pageviews and conversions)
Step 4: Build the Dashboard
Use Power BI, ThoughtSpot, or Tableau to visualise the data. You can group the data by campaign, by landing page, or by funnel stage.
Add filters for:
Date range
Source/medium
Campaign name
Sales pipeline stage
Real-World Example: SaaS Company
A SaaS business was running LinkedIn and Google Ads to drive demos. They had:
GA4 tracking traffic
HubSpot managing leads and pipeline
But they couldn’t see which ads were turning into revenue. We combined their data into a single dashboard and delivered:
A full-funnel report from ad click to closed deal
Campaign ROI ranked by revenue
Alerts for landing pages with high traffic but low lead conversion
Result? They paused underperforming campaigns, doubled spend on two that were working, and saw a 28% increase in lead-to-deal conversion in 90 days.
Real-World Example: Professional Services Firm
A growing consulting firm was investing heavily in content and webinars. They had:
GA4 tracking page views and goal completions
HubSpot tracking form fills, contact activity, and deals
We integrated both and built:
A dashboard showing which blog posts were converting to leads
Web-to-deal funnel showing fall-off points
ROI per content asset
This helped them move budget to the top-performing topics and redesign landing pages that weren’t converting.
Common Pitfalls to Avoid
Not tagging your campaigns: If you don’t use consistent UTM tracking, nothing will line up
Mismatch on attribution windows: GA4 and HubSpot count conversions differently
Not aligning funnel definitions: Make sure “lead” means the same thing in both systems
Trying to do it all manually: Spreadsheets break. Automate the pipeline if you can.
Final Word: Is It Worth It?
If you’re serious about improving campaign ROI, sales velocity, and marketing effectiveness, this is one of the best moves you can make.
Combining GA4 and HubSpot in one dashboard gives you full visibility. You see what’s working, what’s not, and where to focus.
And with the right setup, it doesn’t take a huge team or budget to do it.
At Pentify Insights, we help businesses set this up in a matter of weeks, not months.
Want to see what it could look like for your business? Let’s chat.